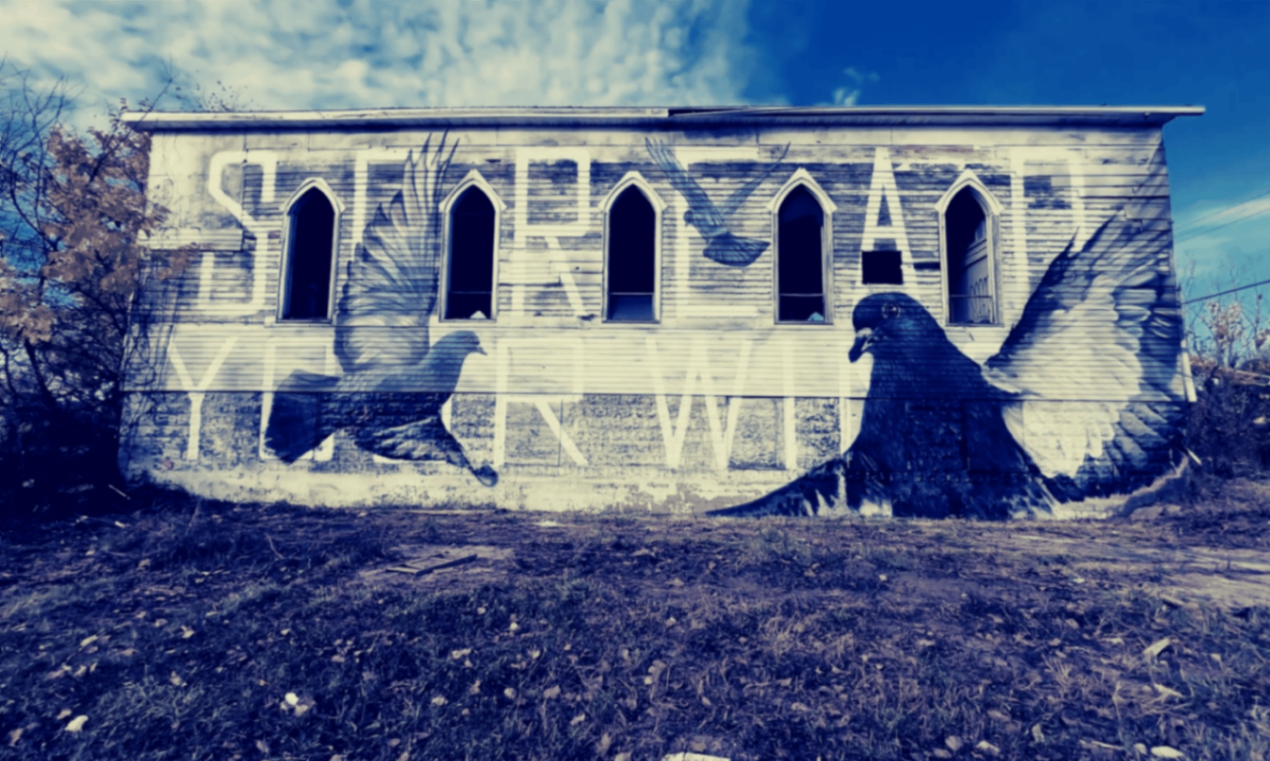
Mural by @aylo_nomad
You've just invested thousands into a new mural project. The artist delivered. The community showed up for the unveiling. Everyone loved it.
But three months later, when the city council asks "Was it worth it?": you have nothing but gut feeling to show them.
Public art has always been difficult to measure. Unlike a museum exhibition with ticket sales or a concert with attendance numbers, murals exist in open spaces where engagement happens invisibly. Someone walks by, stops, takes a photo, shares it with friends. That's impact. But how do you prove it?
Why Mural Analytics Matter
Public arts organizations operate in an increasingly data-driven funding environment. Grants require impact reports. City councils want ROI metrics. Sponsors need engagement numbers.

Mural by @kev_scraps14
Traditional methods of measuring public art impact: visitor surveys, visual observation, media mentions: capture only fragments of the full picture. A survey might reach 50 people. An observer can count foot traffic for a few hours. Media coverage tracks mentions but not actual community engagement.
Mural analytics offer something different. They provide continuous, passive data collection that captures real engagement without interrupting the viewer experience. When someone scans a QR code plaque next to your mural, you learn what time they visited, which piece they engaged with, and how long they spent reading the content.
The data compounds over time. After six months, you know which murals get the most engagement. After a year, you can identify seasonal patterns. After multiple projects, you understand what drives community interaction.
The Metrics That Actually Matter
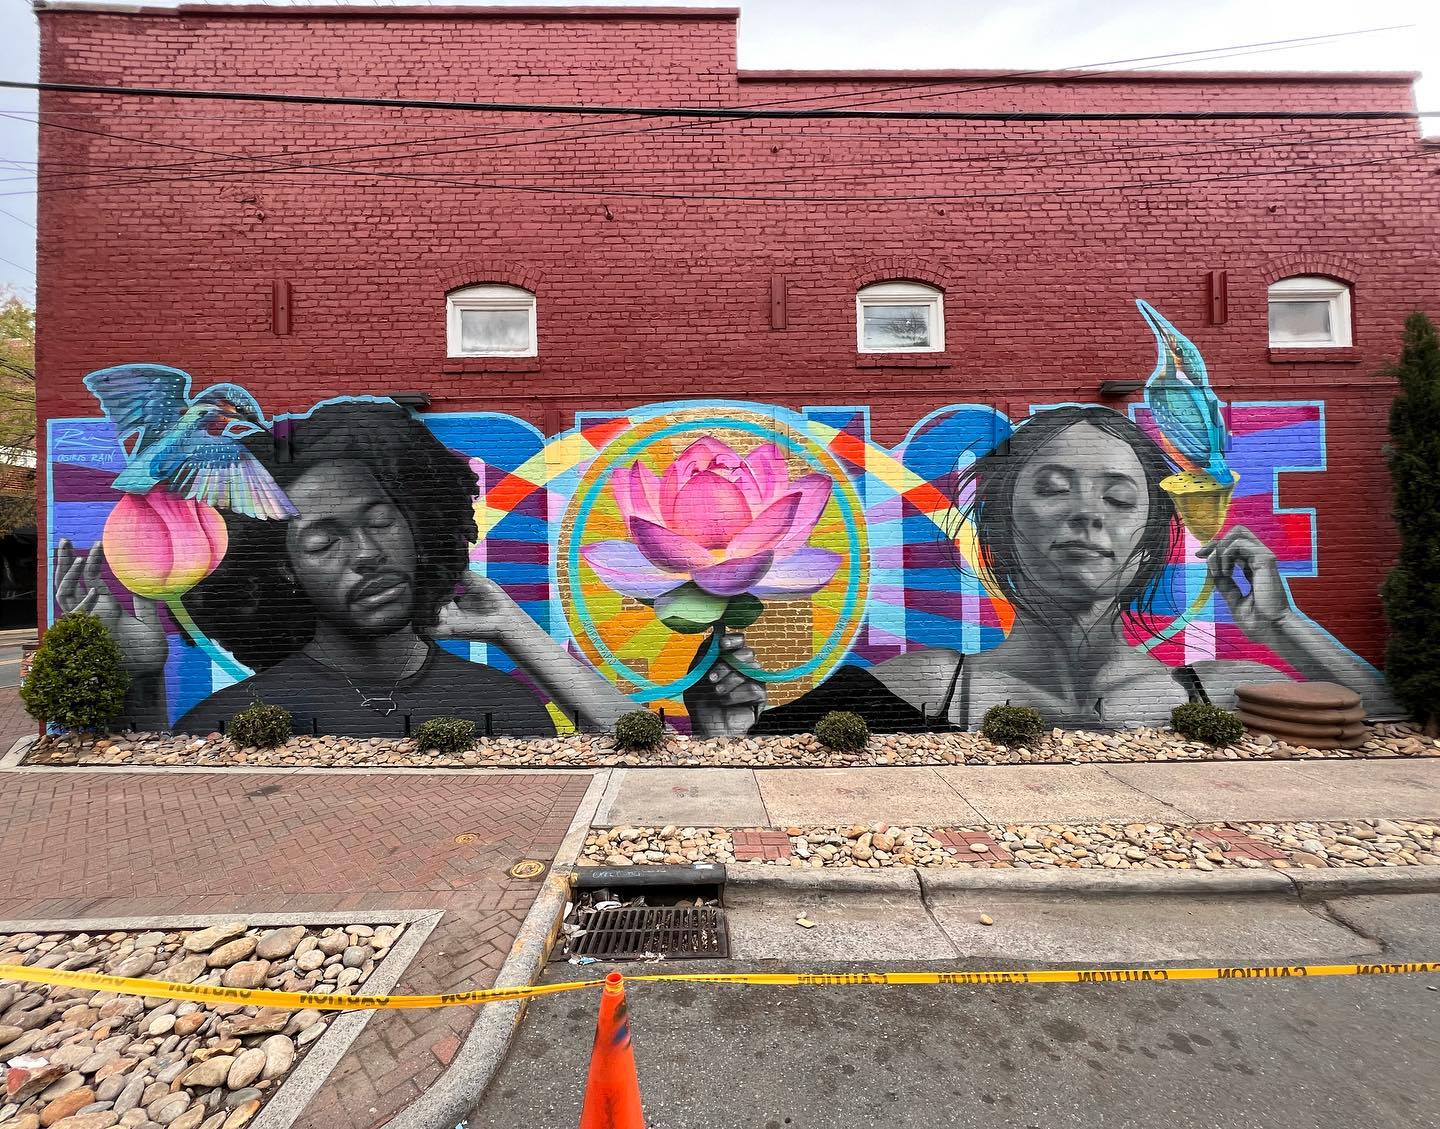
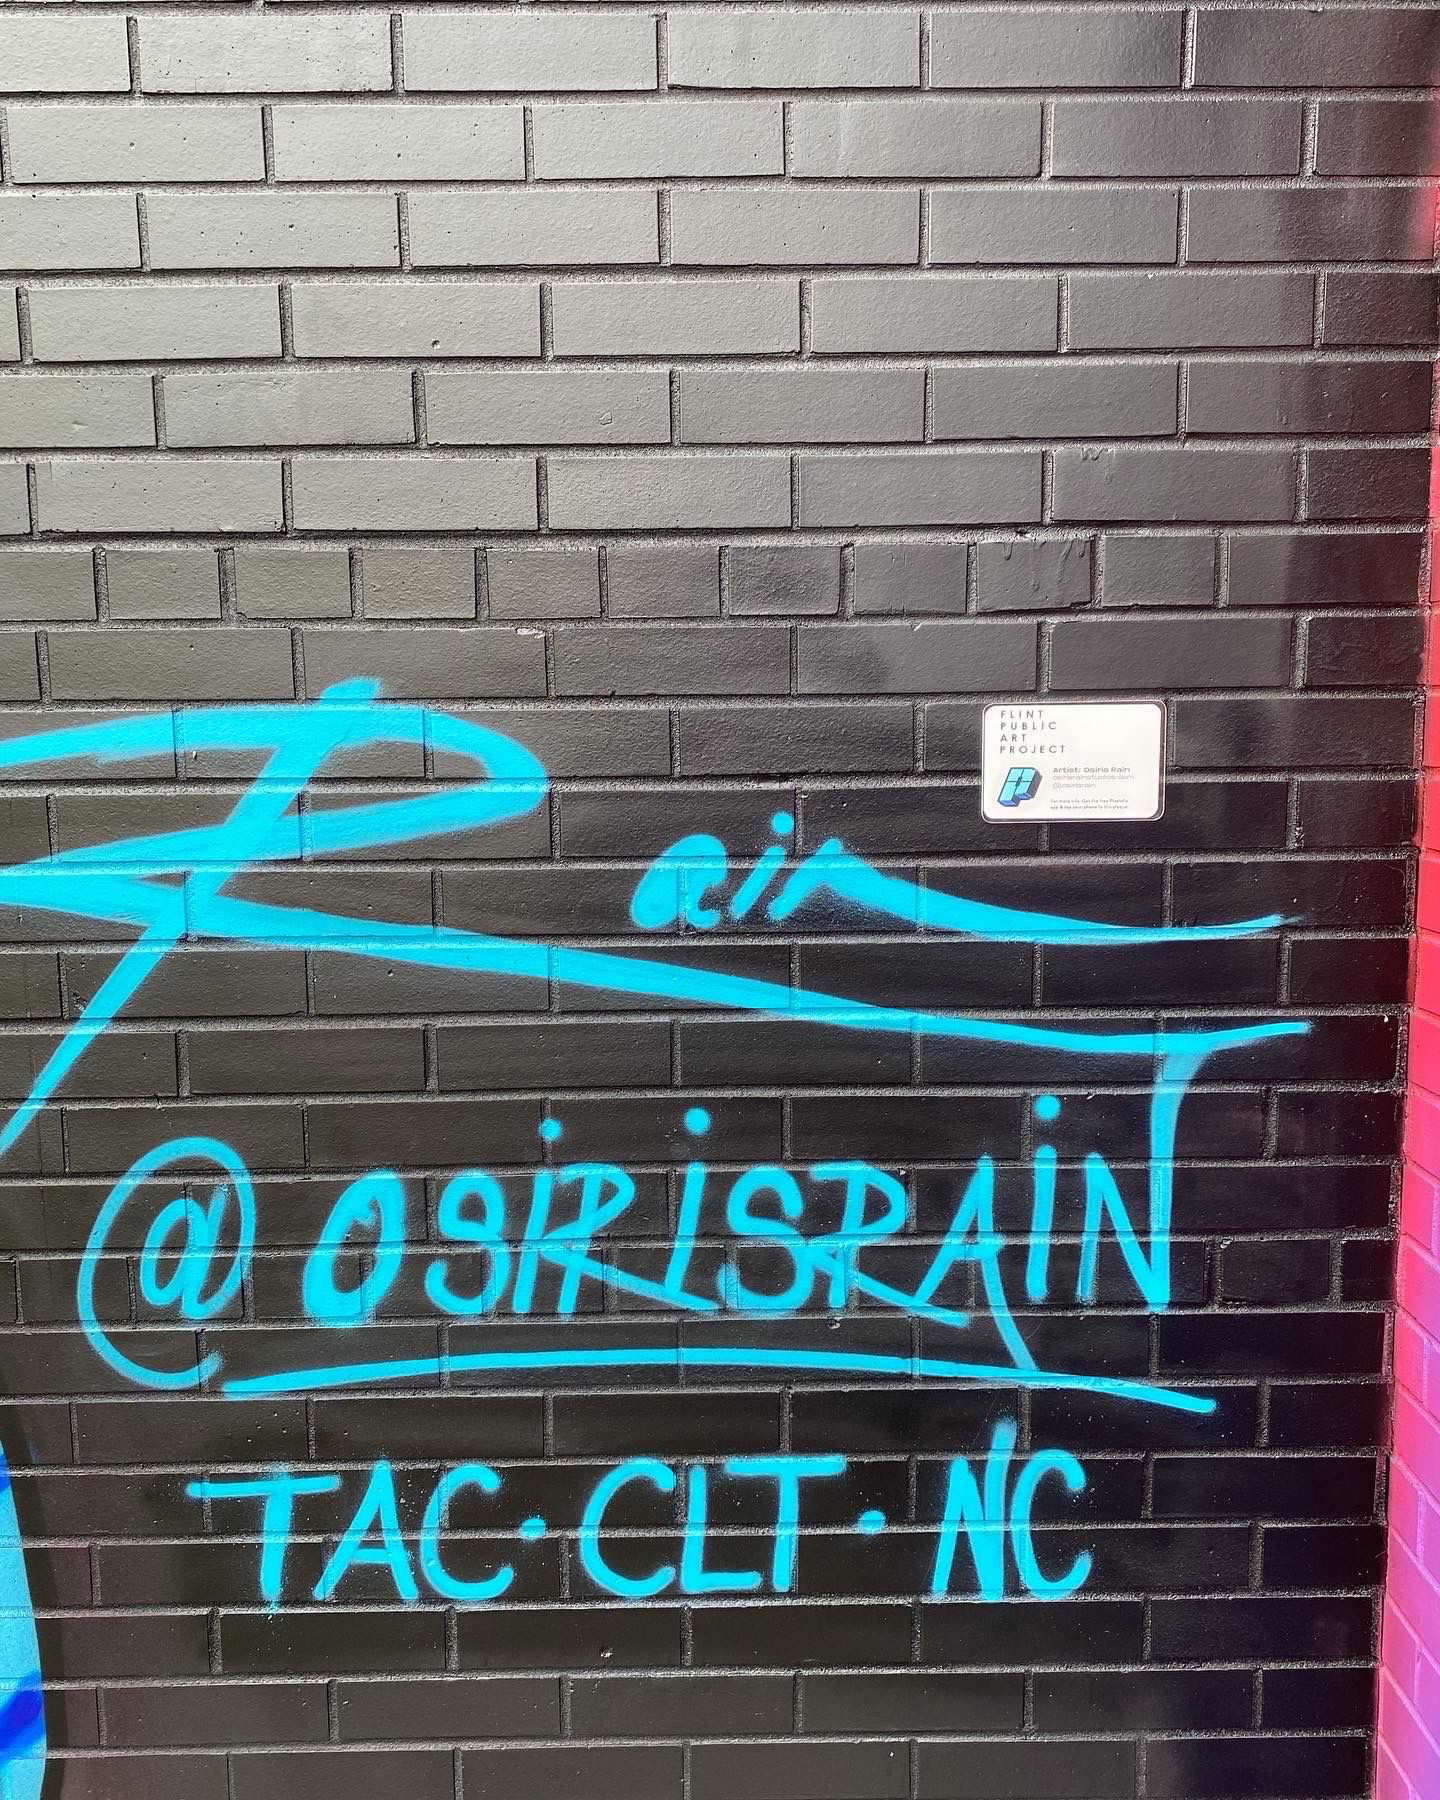
Mural by @osirisrain
Not all analytics are equally useful. Vanity metrics feel good but don't tell you much. Here are the measurements that matter for public art:
Engagement rate measures how many people interact with your mural beyond walking past it. If your QR code plaque gets 200 scans in a month and your mural is on a street with 10,000 pedestrians, your engagement rate is 2%. That's your baseline. Track it over time.
Dwell time indicates how long people spend with your artwork. A mural that consistently holds attention for 3-4 minutes creates deeper community impact than one where people glance and move on. Digital plaques that provide artist stories, audio content, or interactive elements naturally increase dwell time.
Geographic reach shows whether your public art serves only locals or attracts visitors from across the region. When someone scans an NFC plaque, you can see their general location data. A mural that draws people from 30+ miles away has different impact than one serving a single neighborhood.
Return engagement reveals whether people come back. Someone who scans your mural plaque three times over two months is more engaged than someone who scans once and never returns. This metric is particularly valuable for mural trail maps where the goal is repeated exploration.
Social amplification tracks how your physical artwork extends into digital spaces. Your plaque gives viewers the context (artist info, stories, process) that makes them more likely to post photos and talk about the mural on social media, helping the artwork travel further online.
How to Collect Mural Analytics
The technology for measuring public art engagement has become surprisingly accessible. You don't need a data science team or enterprise software.
QR code plaques provide the simplest entry point. A weather-resistant plaque mounted next to your mural contains a QR code that links to artist information, audio tours, or interactive content. Every scan generates data. You learn when people engage, which pieces get the most attention, and how your audience grows over time.
A Smart Plaque costs $60 and lasts 5-7 years outdoors. Installation takes 20 minutes. The return on that investment appears in your next grant report.
PixelStix Smart Plaques come standard with both QR and NFC. Viewers can scan or tap based on what their phone supports, so the same plaque works with every mobile phone without making you choose one technology over the other.
Analytics dashboards transform raw scan data into actionable insights. A good admin portal shows you engagement over time, location heat maps, peak visiting hours, and comparative performance across multiple murals. You export reports formatted for grant applications, council meetings, or sponsor presentations.
Monthly dashboard access is $50, covering unlimited murals and unlimited users. That's less than most organizations spend on coffee for a single board meeting.
Mural Activations: Creating Engagement Opportunities
Analytics reveal what's happening. Mural activations make things happen.
A mural activation is an immersive audio experience designed to be heard while viewing the mural. Think short audio plays, narrated stories, or performances that start when someone scans or taps the Smart Plaque.
The analytics connection matters because activations create measurable engagement spikes. When you publish new audio tied to a mural, you will see scan volume rise and dwell time increase as people listen.
One example is Mural Plays, where a Repertoire theater produced 5-minute audio plays based on murals in the Flint Public Art Gallery. Viewers listened on-site while looking at each piece, turning a quick stop into a full experience.

Mural by @_emilyding
Each activation generates data that informs future programming. You discover which murals hold attention longest. You learn which audio formats drive return visits. You build an evidence base for future funding.
Getting Started: Your First 30 Days
Implementing mural analytics doesn't require overhaul your entire public art program. Start small and scale.
Week 1: Choose one existing mural for a pilot program. Select a piece in a high-traffic area where you want better data. Order a Smart Plaque with both QR and NFC built in.
Week 2: Develop the digital content people will see when they scan. Include artist bio, creation process, community story, or historical context. Add 2-3 photos showing the mural's creation. Keep the content concise: 300-500 words that load quickly on mobile.
Week 3: Install the plaque next to your mural. Mount it at chest height, 2-3 feet from the mural edge. Take a photo showing the plaque and mural together. Share that photo on social media with instructions for engagement.
Week 4: Check your analytics dashboard. Note baseline engagement rates. Identify peak visiting hours. Look for patterns in weekly traffic. Use this data to plan your first activation.
After 30 days, you'll have real numbers to compare against future projects. You'll understand how analytics inform programming decisions. And you'll have evidence to show funders that data-driven public art management is possible.
The next mural gets a plaque from day one. The mural after that becomes part of a trail map. Six months in, you're running activations based on engagement patterns you've discovered. A year in, your grant reports include analytics that other organizations can't match.
What You'll Actually Learn
Mural analytics reveal surprising patterns. You'll discover that your least expensive mural gets the most engagement. You'll learn that weekday evenings drive more traffic than weekend afternoons. You'll find that murals near coffee shops get scanned three times as often as murals near bars.
These insights change how you plan future projects. You site murals strategically. You schedule activations during proven peak times. You invest in the content types that drive engagement.
The data also protects your program. When budget cuts threaten public art funding, you present engagement metrics showing that 12,000 people interacted with your murals last quarter. When sponsors evaluate renewal, you demonstrate how their logo appeared in content shared 400 times. When artists want to know if anyone noticed their work, you show them that 50 people scanned their plaque last week alone.
Measuring public art impact used to mean guessing. Now it means knowing. The technology exists. The cost is minimal. The insights are immediate.
Start with one plaque on one mural. The data will tell you what to do next.